This study introduces IRC’s new Auto Injury Claims Analytics Database (AICAD), which uses new methodologies to leverage IRC’s four decades of claims research. AICAD includes data from nine insurers representing approximately 43 percent of the U.S. private passenger auto market. The dataset covers more than 7.4 million auto injury claims closed with payment over ten half-year periods from mid-2017 through mid-2022 and across five coverages, bodily injury (BI), personal injury protection (PIP), medical payments (MedPay), uninsured motorists (UM), and underinsured motorists (UIM).
This first report examines countrywide claim trends, with particular focus on rising BI claim severity, and presents results on claim costs, settlement timelines, attorney involvement, policy limits, and medical treatment. Future studies will look at geographic variations in attorney involvement and litigation, medical treatment patterns, medical pricing, and other issues affecting auto injury claims.
Key Findings
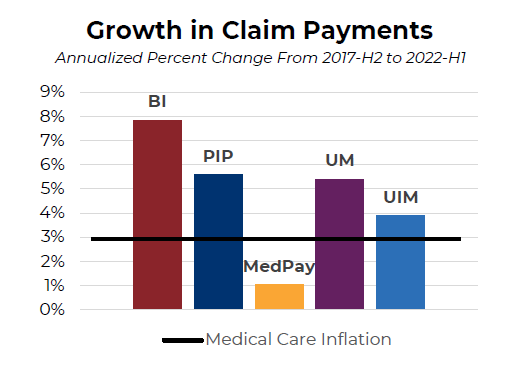
Rising Claim Costs: BI claim severity rose sharply, with rising medical costs amplified by general damages settlements. Average BI claim payments increased 7.8 percent annualized, double the pace of medical care inflation, with growth accelerating sharply after the pandemic. On average, BI claimants received $2.00 in total settlement for every dollar of medical bills paid, not accounting for any legal fees. That leverage ratio rose from $1.80 in early 2018 to more than $2.30 by mid-2022.
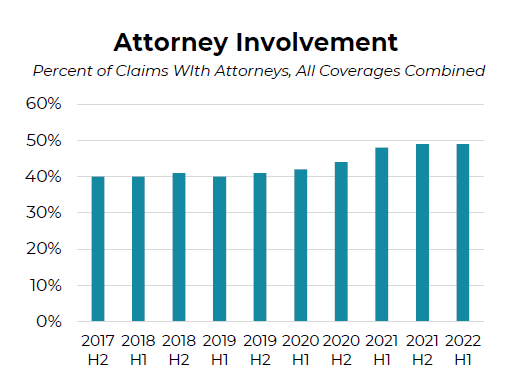
Growing Attorney Involvement: Attorney involvement and litigation both increased significantly across all coverages. For all coverages combined, the share of claimants represented by attorneys rose from 40 percent in 2017 to nearly 50 percent in 2022, while the litigation rate nearly doubled, from 10 percent to 18 percent. Among BI claimants, the attorney involvement rate rose to 57 percent in 2022.
Impact of Attorney Involvement: On average, represented BI claimants netted less money and waited far longer for resolution. After accounting for medical costs and legal fees (estimated at one-third of settlement), BI claimants with attorneys received $1.40 in claim payment for every dollar of medical expense, compared with $1.80 for claimants without attorneys. In addition, represented BI claimants waited a median of nearly 440 days for claim closure, more than double the time for claimants without attorneys.