The affordability of auto insurance is an important public policy issue, given the requirements in nearly all states for drivers to maintain minimum coverage. While some current affordability conversations focus on differing opinions about how insurance costs should be distributed and shared, underlying costs ultimately drive overall affordability. Examining the cost drivers in different states can reveal opportunities for improving affordability for all consumers.
Underlying costs ultimately drive overall affordability.
IRC has developed a measure of auto insurance affordability, the affordability index, which is the ratio of average auto insurance expenditures to median household income. It measures the proportion of household income used to pay for auto insurance; a higher index indicates less affordable insurance. Data for median household income are from the U.S. Census Bureau. Data on average auto insurance expenditures are published by the National Association of Insurance Commissioners (NAIC). While some studies of affordability estimate insurance costs by gathering rating quotes for minimum coverage, the NAIC measure provides an estimate of what consumers actually spend per insured vehicle. As such, the data reflect differences between states in terms of coverage requirements, policy selections, tort laws, and other factors.
The goal of calculating an affordability index is not to establish a particular threshold at which auto insurance becomes affordable or unaffordable. Such a threshold would be subjective, as different parties can reasonably disagree about what would constitute affordable insurance. Rather, the index is a tool to measure and compare auto insurance affordability over time and across jurisdictions.
This analysis looks at the affordability of auto insurance for the overall population and does not address the issue of affordability among underserved populations. Affordability among minority and lower-income consumers is an important topic but requires the examination of more granular data than the countrywide and statewide data presented in this analysis. Moreover, it is important to note that affordability for traditionally underserved consumers is ultimately determined by underlying costs, just as it is for the overall population. A recent analysis of NAIC data showed that the higher premiums in lower-income ZIP codes were in line with the higher claim costs in those areas. Efforts to improve the affordability of auto insurance in those areas must address these higher costs.
Countrywide Trends
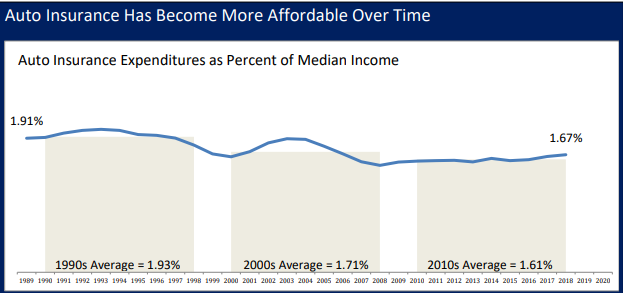
In 2018, the most recent year for which data are available, the average auto insurance expenditure was $1,057. Median household income in 2018 was $63,179. Thus, U.S. households spent 1.67 percent of their income on auto insurance, a slight increase from the previous year but significantly lower than the peak of 2.03 percent in 1993. Future data will help illuminate the impact of the COVID-19 pandemic on driving and insurance costs.
The historical trend in the expenditure-to-income ratio shows that auto insurance has become more affordable over time for the average U.S. consumer. In the 1990s, the median household spent 1.93 percent of its income to pay for auto insurance. The index dropped to an average of 1.71 percent in the 2000s and has averaged 1.61 in the 2010s.
State Rankings
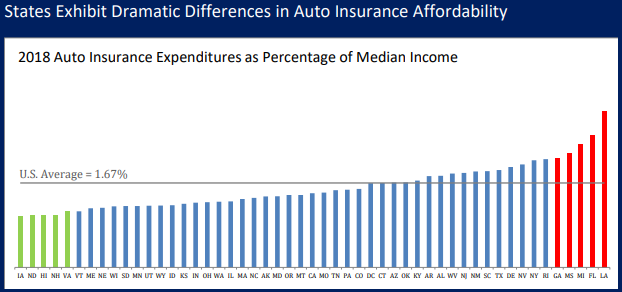
Based on the 2018 affordability index, auto insurance was most affordable in Iowa, where households spent 1.02 percent of income on auto insurance. Other states with low expenditureto-income ratios in 2018 included North Dakota, Hawaii, New Hampshire, and Virginia. By a wide margin, the least affordable state in 2018 was Louisiana, with an index value of 3.09 percent. Rounding out the top-five least affordable states were Florida, Michigan, Mississippi, and Georgia. In 2019, Michigan reacted to affordability concerns by enacting significant auto insurance reforms to address costs in its no-fault system.
The index is a ratio, so some states with high average auto insurance expenditures rate lower on the affordability rankings because of higher-than-average median income. For example, the District of Columbia had the third highest average expenditure in 2018, but, with a median household income that was more than 35 percent higher than the countrywide figure, it ranked as the 21st least affordable jurisdiction. Other states are pushed up the ranks of least affordable states by having low median household income. For example, Mississippi’s auto insurance expenditures were 8 percent below the countrywide average but its median household income is the lowest in the nation; as a result, Mississippi ranked as the fourth least affordable state for auto insurance in 2018.
Louisiana, Florida, and Michigan have maintained their respective rankings as the first, second, and third least affordable states since 2014. The state with the most deterioration in affordability between 2014 and 2018 was Georgia, where an 8.6 percent annualized increase in expenditures led to a 0.42 point rise in the expenditure-to-income ratio. West Virginia showed the most improvement in affordability, with a 0.36 point decline in the index, buoyed by slower-thanaverage expenditure growth and higher-than-average income growth.
Cost Drivers
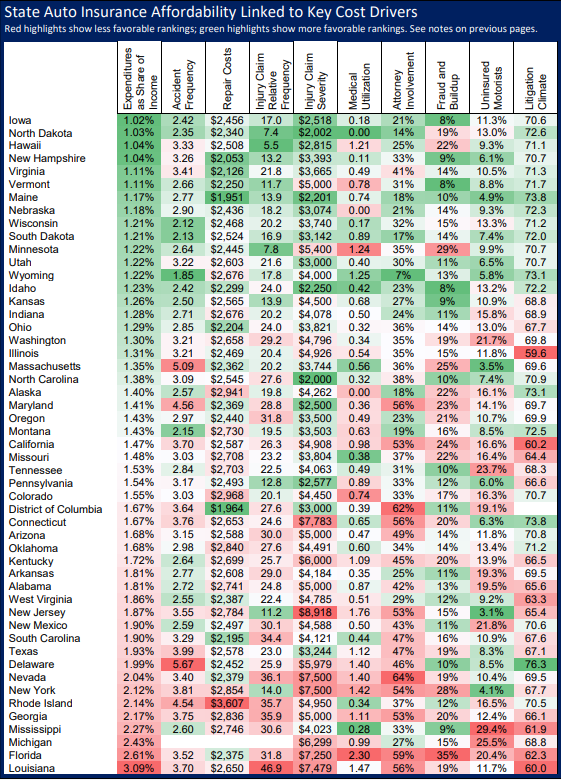
Ultimately, the affordability of auto insurance is determined by the key underlying cost drivers. Efforts to improve affordability, both overall and within traditionally underserved populations, must address these costs. The specific factors driving high insurance costs can vary from state to state. Many of these key cost drivers are described below and shown in the following table.
Accident frequency: Greater traffic density, poorer road conditions, and other factors lead to more frequent accidents in some states. Differences in accident frequency are approximated by showing each state’s number of property damage liability claims filed per 100 earned car-years. The source is the Fast Track Monitoring System; data shown are from 2019.
Repair costs: The cost of repairing vehicles varies across states. The table shows the median claim payment amount for private passenger auto property damage liability and collision claims combined. The source is data collected for the 2021 IRC report Patterns in Auto Physical Damage Insurance Claims, with data from 2018.
Tendency to file injury claims: The propensity to file an injury claim tends to be higher in less affordable states. The ratio of bodily injury (BI) liability claim frequency to the frequency of auto property damage (PD) liability claims provides a measure of the likelihood that an injury claim will be filed that accounts for differing accident rates. The source is the Fast Track Monitoring System; data are from 2019.
Injury claim severity: The amount paid per claim for auto injury insurance claims is a key cost driver. Because the mean payment is highly influenced by the policy limits in a given state, the median payment is shown, based on 2017 data, for all injury coverages combined from the IRC study Countrywide Patterns in Auto Injury Insurance Claims.
Medical utilization: High rates of utilization of expensive diagnostic procedures and medical treatments are a common cost driver in states with affordability issues. Using 2017 data from the IRC study Countrywide Patterns in Auto Injury Insurance Claims, a medical utilization index was calculated based on the usage of magnetic resonance imaging (MRI).
Attorney involvement: Attorney involvement in auto injury claims has been associated with higher claim costs and delays in settlement time. The percentage of claimants represented by attorneys across all five private passenger coverages is shown, with 2017 data from IRC’s Countrywide Patterns in Auto Injury Insurance Claims.
Claim abuse: Although difficult to measure, insurance fraud is a factor in the high cost of insurance in several states. Claim abuse can take the form of outright fraud but also includes buildup, which refers to unnecessary or excessive medical treatment or other charges in an otherwise legitimate claim. The table shows the percentage of all auto injury claims from IRC’s 2012 closed-claim study that were found by file reviewers to involve the appearance of claim fraud and/or buildup.
Uninsured motorists: High rates of uninsured motorists can be both a symptom and a cause of affordability challenges. The data shown are from IRC’s study Uninsured Motorists: 2021 Edition, with 2019 being the latest year available.
Litigation climate: The legal environment for settling auto insurance claims varies by state. For example, some states allow third-party bad-faith lawsuits for insurance claims while others do not. The Institute for Legal Reform conducts an annual survey of business leaders seeking opinions about the legal environment. The 2019 survey from provides a proxy for each state’s legal environment.
The table that follows shows a value for each of these cost drivers in each state, with colorcoding representing where each jurisdiction rates relative to the rest of the country. The red highlights show that the states with higher expenditure-to-income ratios tend to have less favorable rankings with respect to these cost drivers, while the green highlights illustrate the more favorable rankings among the more affordable states.
This visual evidence shows the importance of these factors in determining overall auto insurance affordability. Moreover, cost driver analysis can provide direction for policymakers in individual states exploring ways to improve the affordability of auto insurance in their specific jurisdictions.
Cost driver analysis can provide direction for policymakers in individual states exploring ways to improve the affordability of auto insurance in their specific jurisdictions.