Key Drivers of State Variations in Personal Auto Insurance Costs
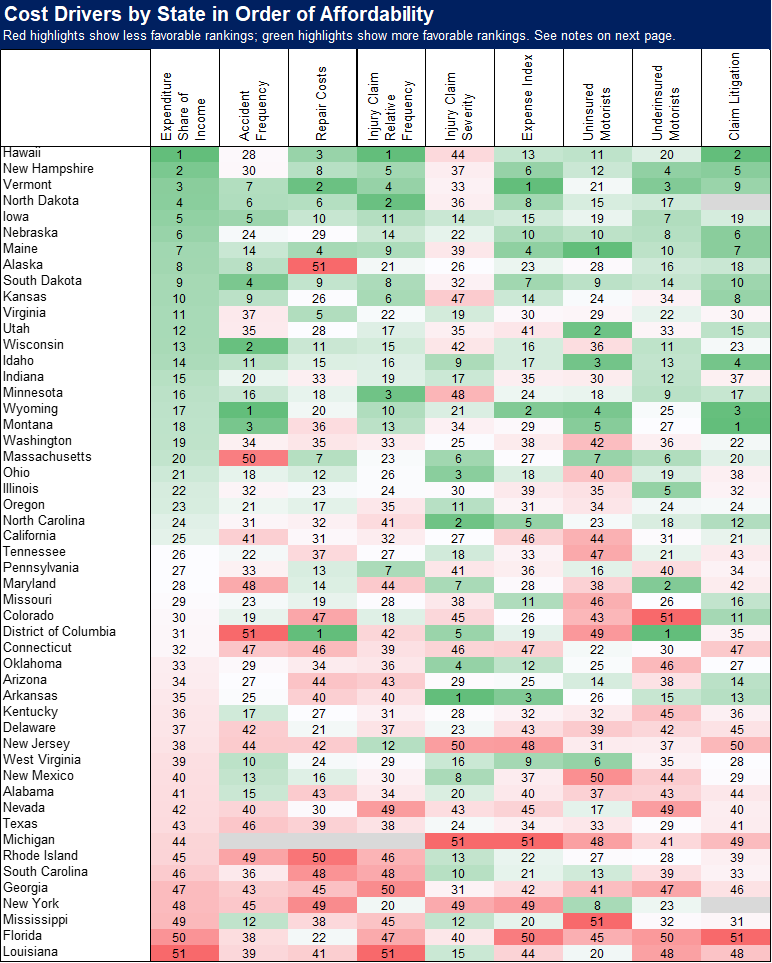
IRC calculates an index to measure the affordability of auto insurance. The affordability index is the ratio of average auto insurance expenditures to median household income. It measures the proportion of household income going to pay for auto insurance, where a higher index indicates less affordable insurance. Average auto insurance expenditures data are published by the National Association of Insurance Commissioners (NAIC) in their Auto Insurance Database Report; data are from 2023.
Varying traffic density, road conditions, and other factors lead to more frequent accidents in some states. Differences in accident frequency are approximated by showing each state’s number of property damage liability claims filed per 100 earned car years. The source is the Fast Track Monitoring System; data are from 2023.
The cost of repairing vehicles varies across states. The table shows the median claim payment amount for private passenger auto property damage liability and collision claims combined. The source is the Fast Track Monitoring System; data are from 2023.
The propensity to file an injury claim tends to be higher in less affordable states. The ratio of bodily injury (BI) liability claim frequency to the frequency of auto property damage (PD) liability claims provides a measure of the likelihood of an injury claim being filed that accounts for differing accident rates. The source is the Fast Track Monitoring System; data are from 2023.
The amount paid per claim for auto injury insurance claims is a key cost driver. Because the mean payment is highly influenced by the policy limits in a given state, the median payment is shown. The source is the Fast Track Monitoring System; data are from 2023.
The amount insurers spent to process, investigate, and litigate claims (loss adjustment expenses) as a percent of incurred losses. Based on the five-year average from the NAIC’s Report on Profitability by Line by State in 2023.
High rates of uninsured motorists can be both a symptom and a cause of a system with affordability challenges. The data shown are from IRC’s study Uninsured and Underinsured Motorists: 2017 – 2023, with 2023 being the latest year available.
High rates of underinsured motorists can be both a symptom and a cause of a system with affordability challenges. The data shown are from IRC’s study Uninsured and Underinsured Motorists: 2017 – 2023, with 2023 being the latest year available.
Claim litigation reflects the percentage of personal auto claims with litigation, based on data from NAIC's Market Conduct Annual Statement Scorecard and measured by the ratio of suits opened to claims closed without payment multiplied by the ratio of claims closed without payment to the total claims closed.