Increasing inflation has led to pervasive affordability challenges for U.S. consumers, with the cost of food, gas, and many other goods and services growing faster than household incomes in recent years. Home insurance claim costs have faced additional pressure from increasing catastrophic risk, rising home repair costs, higher insured values, and the migration of populations into areas susceptible to disasters. Insurance companies have also faced challenges related to fraud, excessive claims, and legal system abuse in the aftermath of catastrophic events.
As a result of these cost drivers, homeowners insurance accounts for a larger share of household income than it did two decades ago. In addition to increased homeowners insurance affordability concerns countrywide, some areas are also exhibiting signs of availability problems. Examining affordability trends over time and differences across jurisdictions can reveal opportunities for improving both affordability and availability for all consumers.
This brief updates IRC affordability with the most recent release of homeowners insurance expenditure data from National Association of Insurance Commissioners (NAIC), which is data for 2023. Given the limitations of using 2023 data to discuss affordability trends in this dynamic market, this brief also includes projections for 2024 and 2025 provided by the Insurance Information Institute (Triple-I).
Background and Methodology
The IRC measures homeowners insurance affordability using an affordability index, which is the ratio of average homeowners insurance expenditures to median household income. It measures the proportion of household income used to pay for homeowners insurance; a higher index indicates less affordable insurance.
Data on median household income are from the U.S. Census Bureau. Average homeowners insurance expenditures data are from the NAIC. The IRC uses the average premium amount for dwelling fire and homeowners owner-occupied policy forms, which exclude renters and condo insurance. These data exclude flood and earthquake insurance, which are not part of standard homeowners policies.
The goal of calculating an affordability index is not to establish a particular threshold at which homeowners insurance becomes affordable or unaffordable. Such a threshold would be subjective, as different parties can reasonably disagree about what would constitute affordable insurance. Rather, the index provides a method to compare homeowners insurance affordability over time and across jurisdictions.
This analysis looks at the affordability of homeowners insurance for the overall population and does not address the issue of affordability for specific demographic and income groups or for geographic risk profiles within states. It also does not address changes in coverage or deductibles.
Factors Affecting Countrywide Insurance Costs
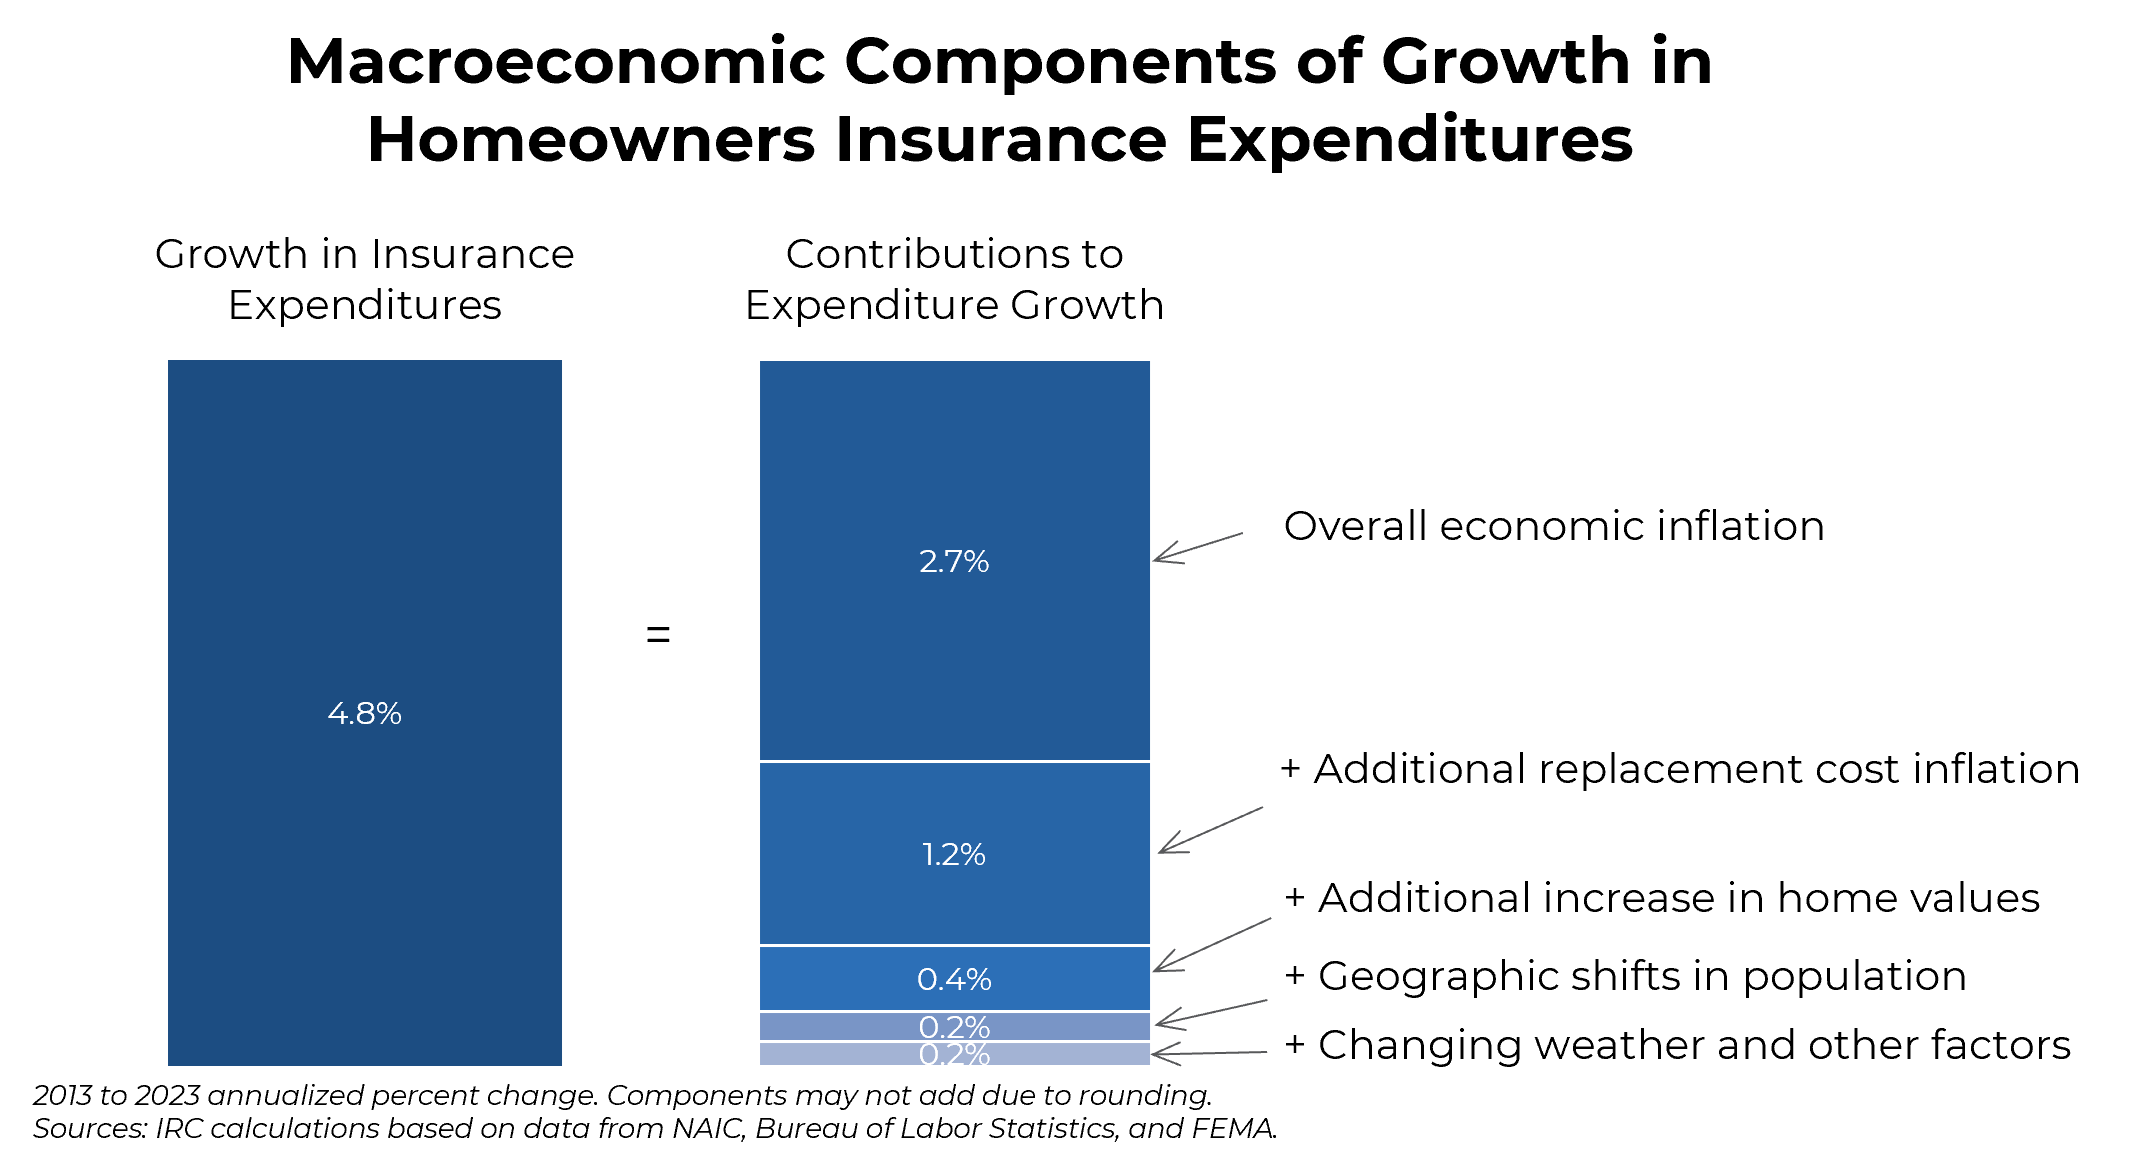
Homeowners insurance premiums increased 4.8 percent annualized from 2013 to 2023, due to several macro factors related to economic, demographic, and environmental conditions. Using several public data sources, IRC allocates that growth rate across five of these macro components. Although such approximations ignore many complexities in timing and impact, it is useful to demonstrate the relative contributions of multiple factors to the trend in insurance affordability.
The largest component is overall economic inflation. The Consumer Price Index for All Items increased 2.7 percent annualized from 2013 to 2023, with much of that increase in the last few years. Replacement cost inflation for homes was even higher. Using the Producer Price Index for Residential Construction Inputs, replacement cost inflation was estimated at nearly 4.0 percent annualized, or 1.2 percent above the overall inflation rate.
More complex home systems and more rigorous building code standards add additional replacement cost pressure. Using NAIC data on exposures by insurance value, IRC estimates that the median insurance value of homes increased 4.4 percent annualized between 2013 and 2023, or an additional 0.4 percent above economic and replacement cost inflation.
Geographic shifts in population are another factor, as people move to areas with greater natural weather risks. Using FEMA’s National Risk Index data on expected annual loss to buildings, IRC examined county population changes between 2013 and 2023 to estimate that demographic shifts accounted for 0.2 percent annualized.
The remaining 0.2 percent is a residual amount and may be attributable to factors such as changing weather patterns, legal system abuse, and other drivers of homeowners insurance costs.
Comparing Growth in Homeowners Insurance Expenditures and Median Household Income
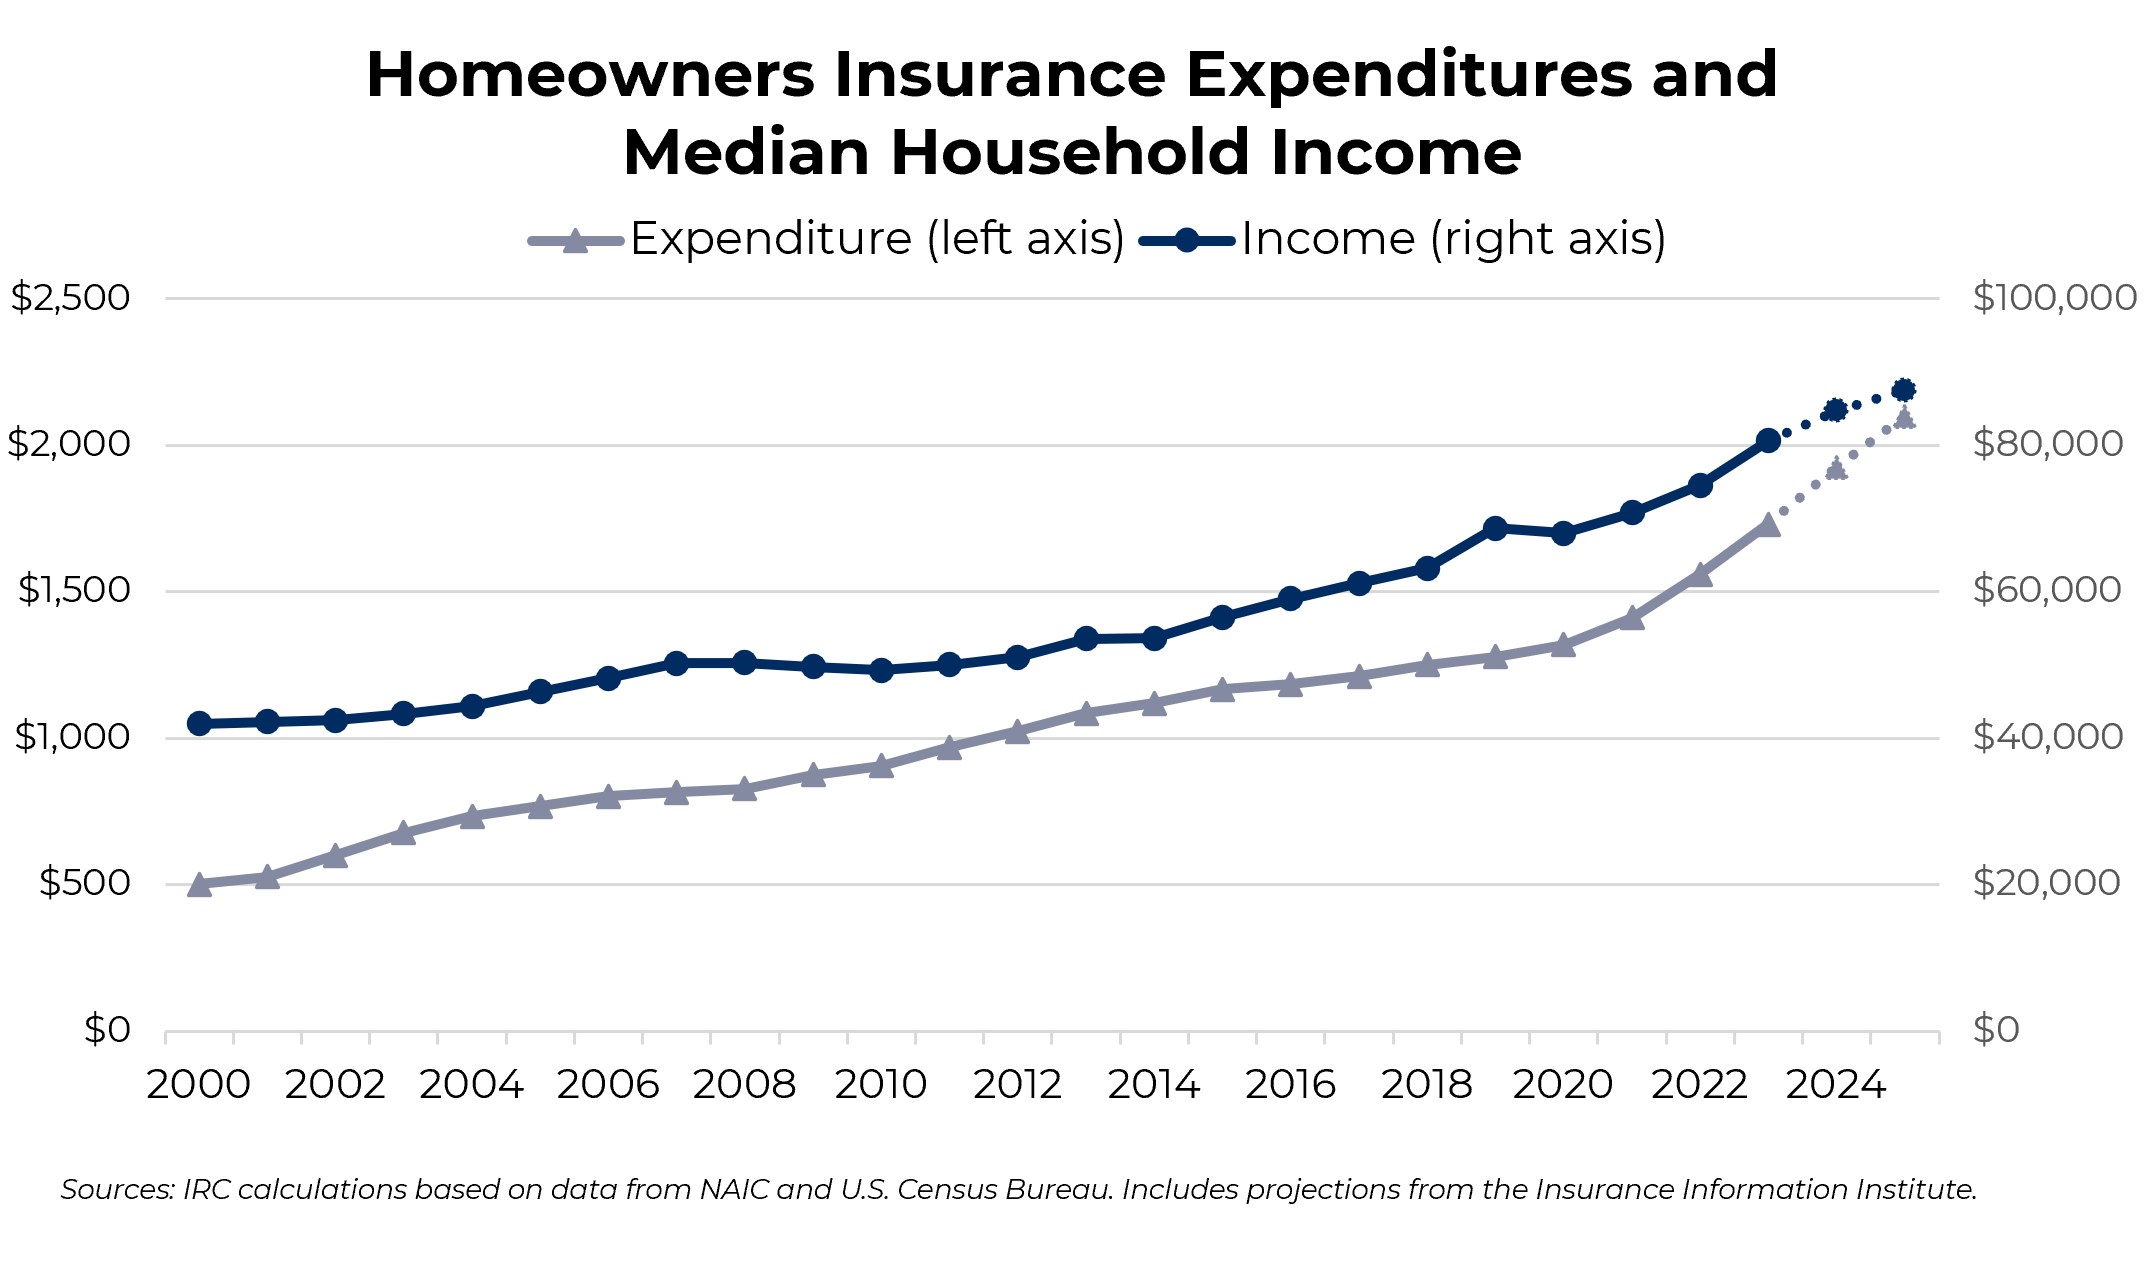
In 2023, the most recent year for which NAIC data are available, the average homeowners insurance expenditure was $1,731, an 11.0 percent increase from 2022. Between 2000 and 2023, insurance expenditures grew 5.5 percent annualized, nearly twice the 2.9 percent annualized growth in median household income.
Recent claim cost increases are expected to push premiums higher still. The Insurance Information Institute (Triple-I) projects average homeowners insurance expenditures will continue to outpace income growth, rising from $1,731 in 2023 to $2,100 in 2025. The homeowners insurance landscape has changed dramatically in recent years, with insurance losses surging upward due to rising home building and repair costs, supply chain disruptions, and natural catastrophes. It is important to note that premium increases reflect rate increases in combination with coverage increases to reflect the full replacement cost of each home, which has been a material contribution in recent years.
Homeowners Insurance Affordability Over Time
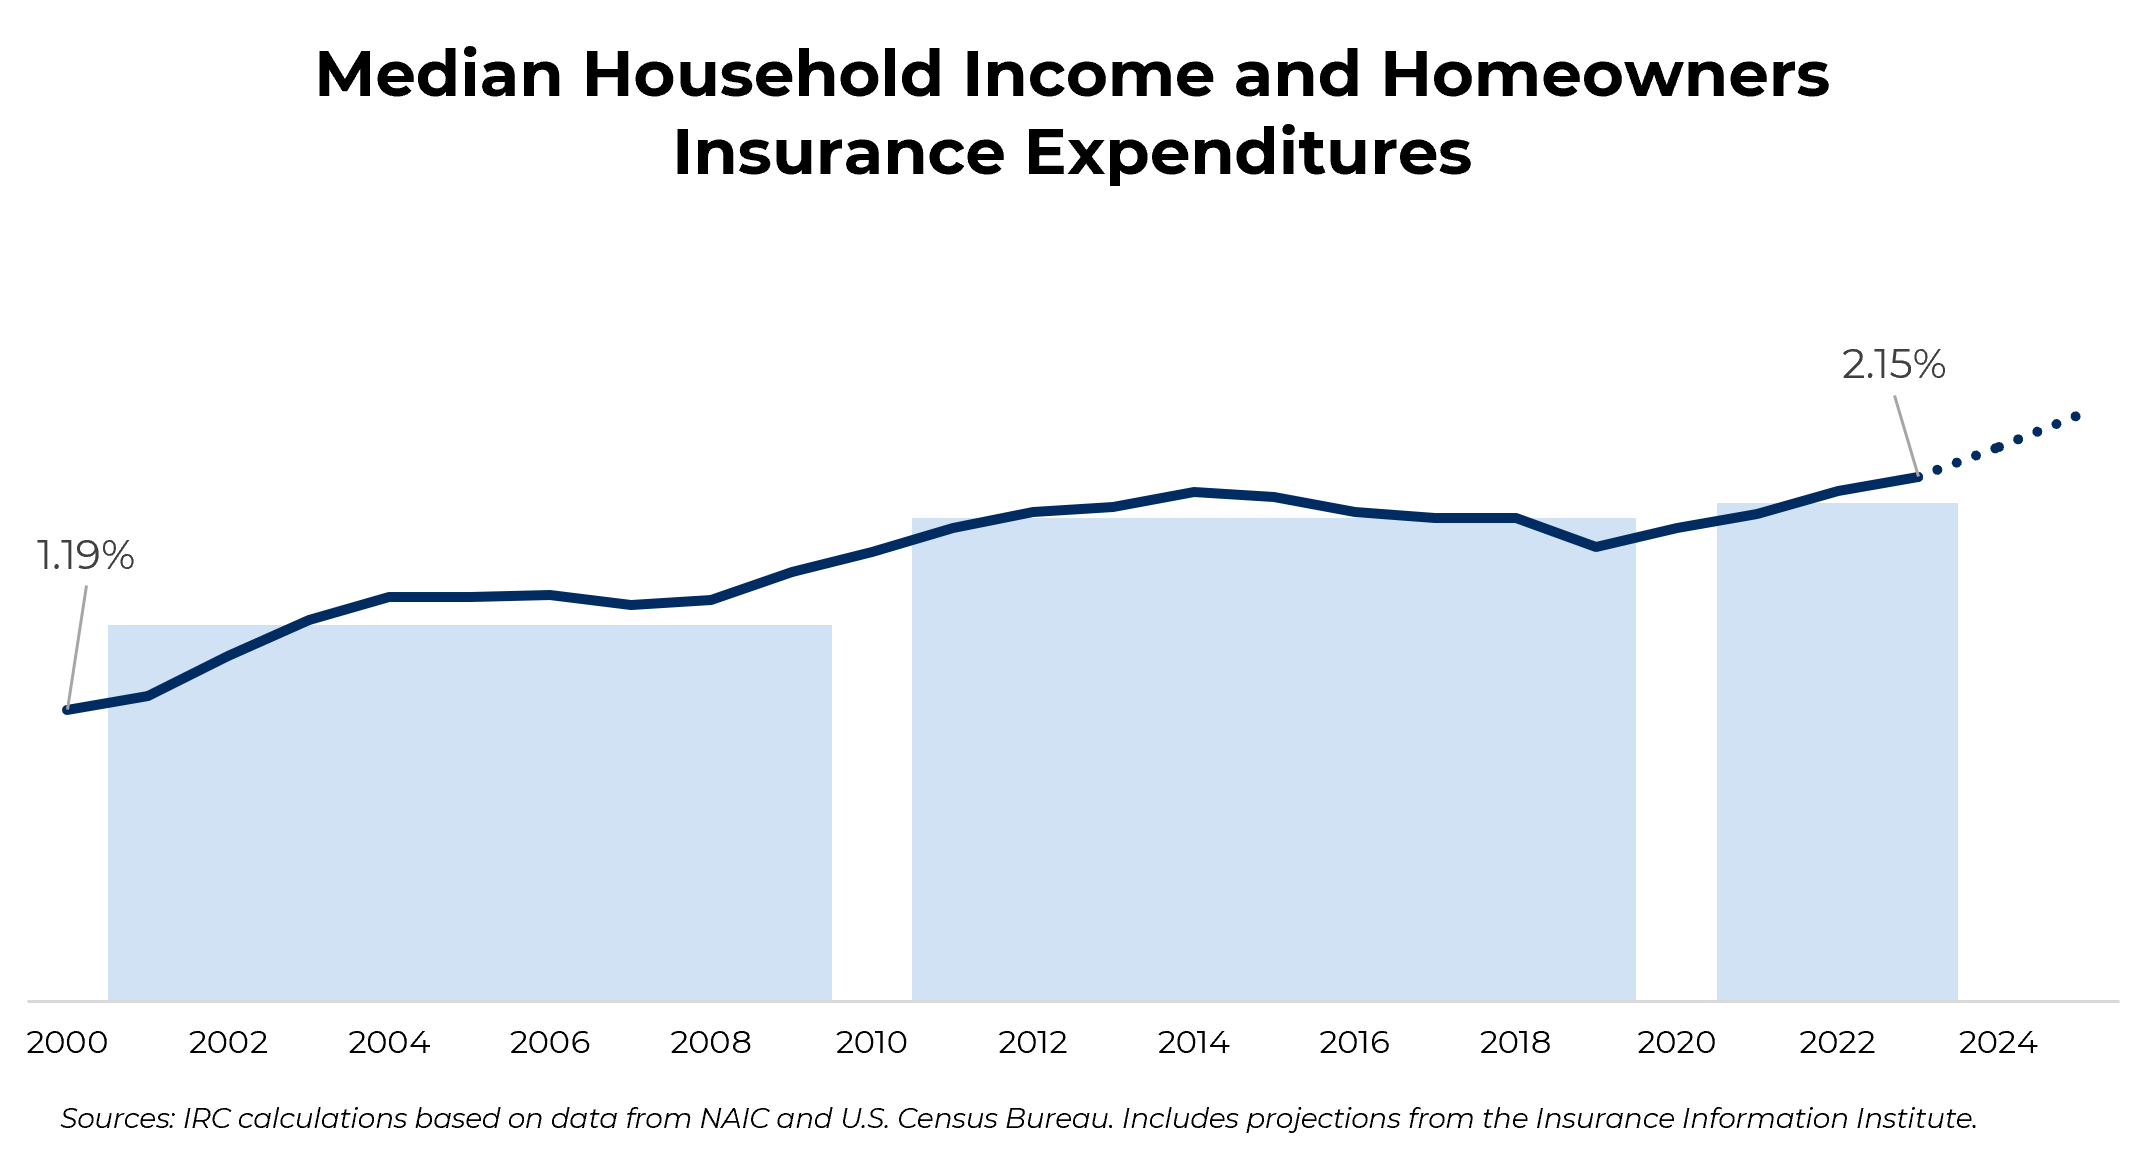
Using 2023 values for average homeowners insurance expenditures and median household income, IRC estimates that the average U.S. household spent 2.15 percent of their income on homeowners insurance. While the share of income spent on homeowners insurance remains small compared to many other segments of household budgets, this is an increase from the previous year (2.09 percent) and surpasses the peak that was set in 2014. In 2001, the average American homeowner spent approximately 1.19 percent of their income on insurance premiums. By 2023, this figure had increased to 2.15 percent.
This upward trajectory has not been uniform. During the 2000s, homeowners insurance consumed an average of 1.54 percent of median household income. The 2010s saw this ratio climb to an average of 1.98 percent, with current trends suggesting continued increases into the mid-2020s. Economic inflation has been a significant factor in making homeowners insurance, and many other goods and services, less affordable in recent years.
Based on Triple-I’s projections for average homeowners insurance expenditure for the years 2024 and 2025, it is estimated that the affordability index will rise to its highest level in this period at 2.4 percent in 2025. This reflects both the rate and coverage increases necessary to offset all loss pressures.
Geographic Disparities in Affordability by State
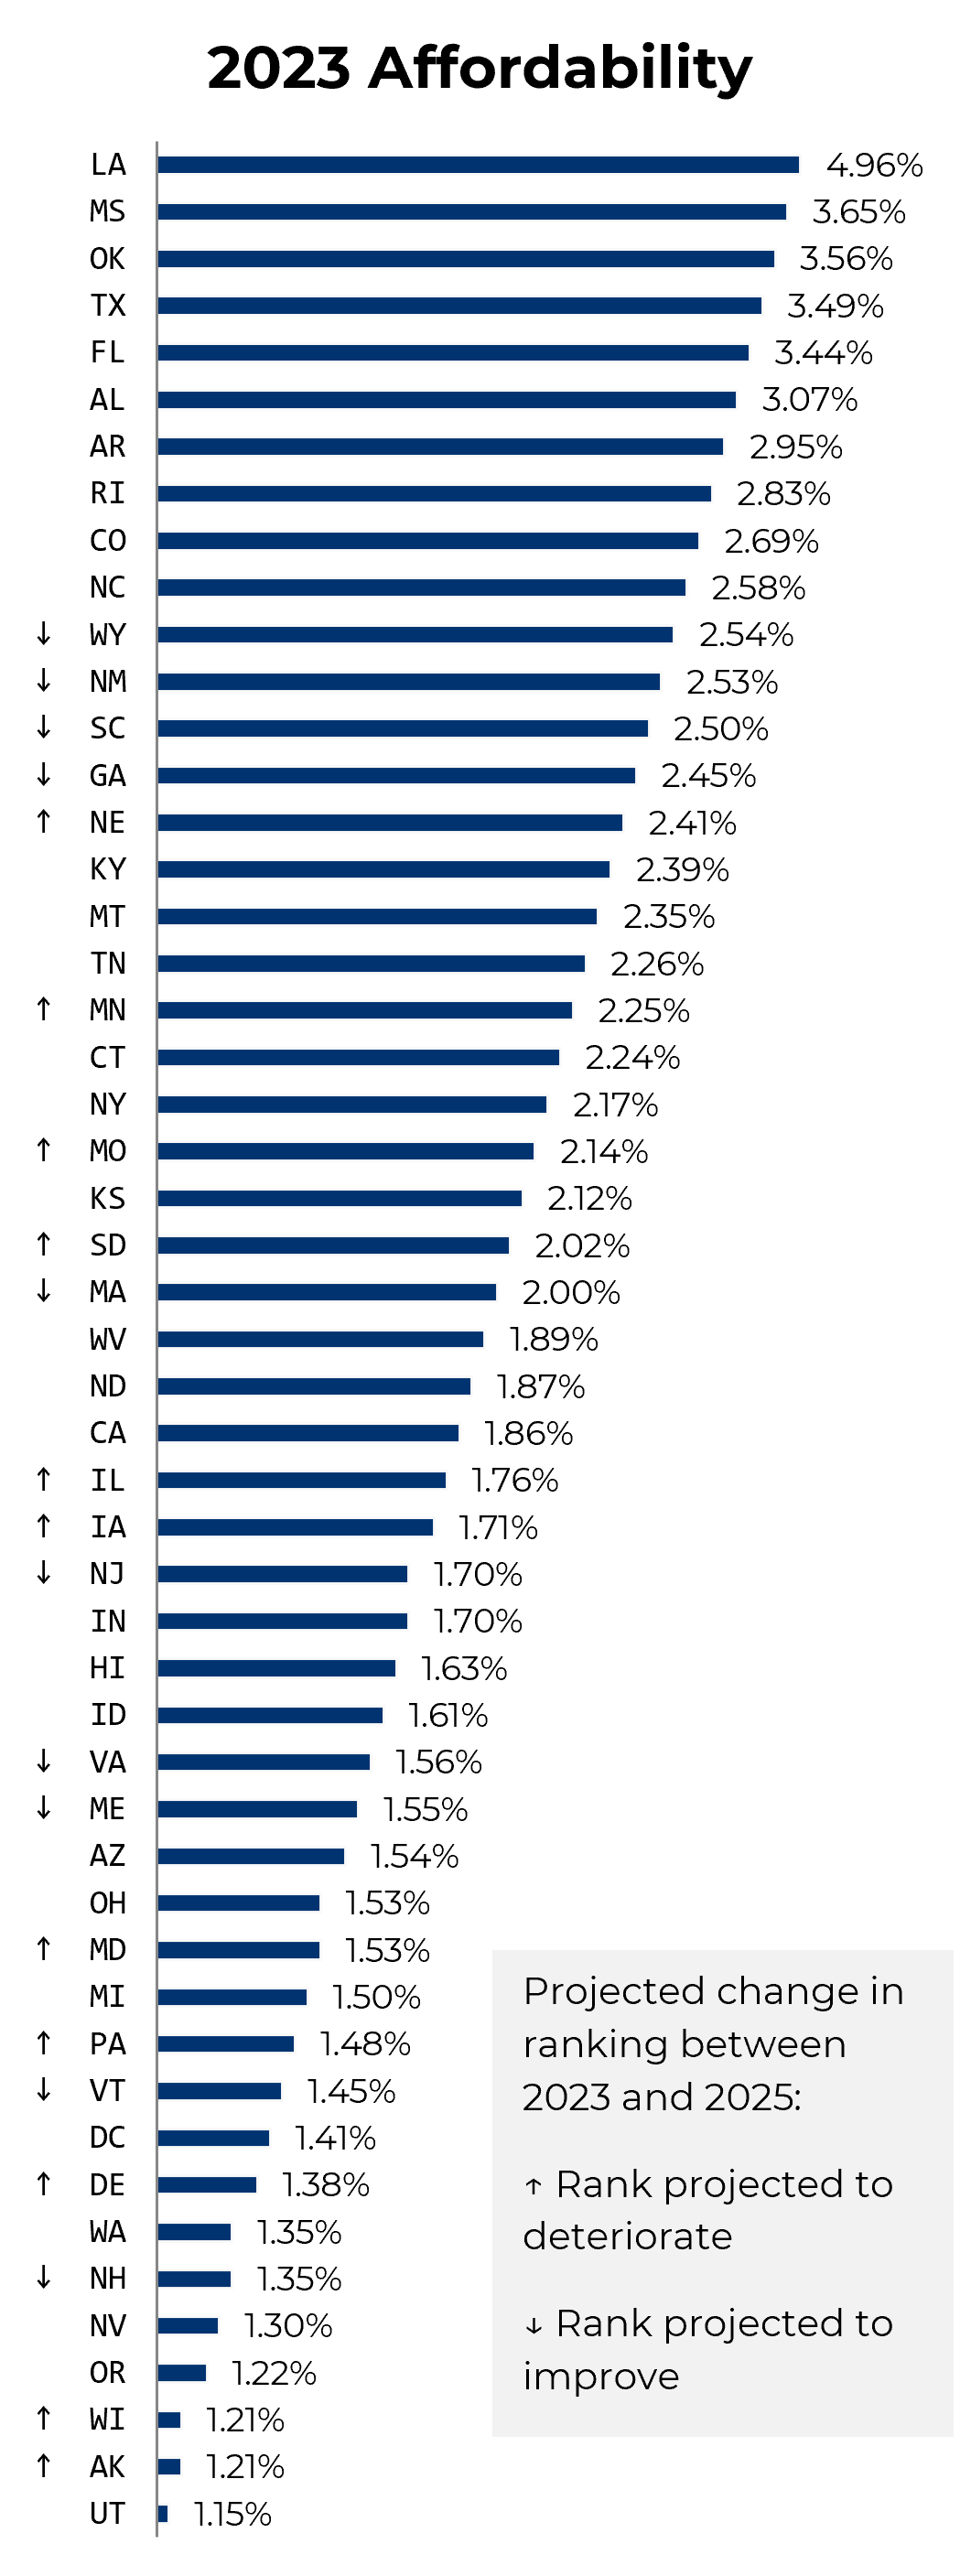
Based on the 2023 affordability index, homeowners insurance was most affordable in Utah, where households spent 1.15 percent of their income on homeowners insurance. Other states with low expenditure-to-income ratios in 2023 included Alaska, Wisconsin, Oregon, and Nevada. The least affordable state in 2023 was Louisiana, with an index value of 4.96 percent. Rounding out the top five least affordable states were Mississippi, Oklahoma, Texas, and Florida.
Florida showed marked improvement in homeowners insurance affordability, moving from the 2nd least affordable state in 2022 to the 5th least affordable state in 2023. Starting in 2022, Florida passed several key reforms that have led to significant decreases in claims lawsuits and increases in the number of insurers in the market, among other positives. Although it will take some time for changes to show up in various cost drivers, Florida was one of only three states (in addition to Missouri and South Dakota) experiencing a decrease in average homeowners expenditure between 2022 and 2023.
Triple-I’s projections indicate worsening homeowners insurance affordability in many U.S. states between 2023 and 2025. States with significant projected changes in affordability ranking from the 2023 affordability rankings are shown with arrows indicating projected improvement in rank (↓) or deterioration in rank (↑) between 2023 and 2025.
Key Drivers of Insurance Costs
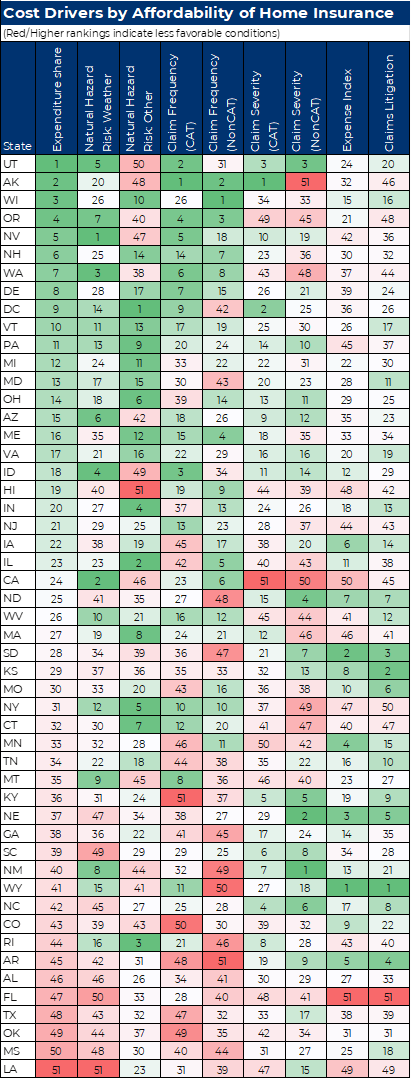
Ultimately, homeowners insurance affordability is determined by the underlying key cost drivers, which must be addressed to improve affordability. The specific factors driving high insurance costs can vary from state to state. Many of these key cost drivers are described below and illustrated in the table that follows.
Weather risk—The expected annual loss per $1 million of aggregate building value from weather related hazards, based on National Risk Index data from the Federal Emergency Management Agency (FEMA), which includes both residential and commercial buildings. Weather hazards include cold wave, hail, heat wave, hurricane, ice storm, lightning, strong wind, tornado, and winter weather. Losses due to coastal or river flooding are excluded since they are not covered by standard homeowners policies. Data from 2025.
Other natural hazard risk—The expected annual loss per $1 million of aggregate building value from non-weather hazards, based on National Risk Index data from FEMA, which includes both residential and commercial buildings. Non-weather hazards include avalanche, landslide, tsunami, volcanic activity, and wildfire. Losses due to earthquake are excluded since they are not covered by standard homeowners policies. Data from 2025.
Claim frequency, catastrophe claims (CAT)—The number of catastrophe claims paid in a particular year for every 100 exposures insured for the entire year. An event is designated a catastrophe by the industry when claims are expected to reach a certain dollar threshold, currently set at $25 million, and more than a certain number of policyholders and insurance companies are affected. Claim frequency is a standardized measure of how often homeowners insurance claims are paid. This report's paid claim frequency data are from the Fast Track Monitoring System. Data from 2025.
Claim frequency, non-catastrophe claims (NonCAT)—The number of non-catastrophe claims paid in a particular year for every 100 exposures insured for the entire year. Claim frequency is a standardized measure of how often homeowners insurance claims are paid. This brief's paid claim frequency data is from the Fast Track Monitoring System. Data from 2025.
Claim severity, catastrophe claims (CAT)—The average claim payment for all catastrophe claims paid during the year. Claim severity measures how much is paid for the average homeowners insurance claim. This brief's claim severity data are from the Fast Track Monitoring System. Data from 2025.
Claim severity, non-catastrophe claims (NonCAT)—The average claim payment for all non-catastrophe claims paid during the year. Claim severity measures how much is paid for the average homeowners insurance claim. This report's claim severity data are from the Fast Track Monitoring System. Data from 2025.
Expense index—The amount insurers spent to process, investigate, and litigate claims (loss adjustment expenses) as a percent of incurred losses. Based on the five-year average from the NAIC’s Report on Profitability by Line by State in 2024. Data from 2024.
Claims litigation—The percent of homeowners claims with litigation, based on data from the NAIC's Market Conduct Annual Statement Scorecard and measured by the ratio of suits opened to claims closed without payment multiplied by the ratio of claims closed without payment to the total claims closed. Data from 2025.
Cost Drivers
The specific factors driving high insurance costs can vary from state to state, as illustrated in this cost driver matrix.
States are ordered by rank on expenditure share. Numbers in each cell are the state’s rank for that cost driver (1 = most favorable, 51 = least favorable).
Cell shading is based on the underlying value of each cost driver, not the rank. Green indicates a more favorable value and red a less favorable value relative to other states in the same column. Because shading follows values, states with adjacent rankings can differ in color when the gap between their values is large, and states with distant rankings can look similar when their values are close.
The visual evidence shows the importance of these factors in determining overall homeowners insurance affordability. Furthermore, the report’s analysis can provide direction for policymakers in individual states to explore ways to improve the affordability of insurance in their specific jurisdictions